Corresponding Web Notes: Utility Scale Solar Power Plants ( pptx / pdf / key)
The State of Solar Power in the U.S. 
Source: My web note set on U.S. Energy Production & Consumption (pptx / pdf / key) U.S. Solar Power Costs: My web note set on Power Plant Economics (pptx / pdf / key) U.S. Solar Photovoltaic System Cost Benchmark: Q1 2018, U.S. National Renewable Energy Lab - NREL (link / cached copy) Solar Market Insight Report 2019 Q2, Solar Energy Industry Association - SEIA (link / cached copy) U.S. Solar Power Growth: Federal Energy Regulatory Commission's Energy Infrastructure Update - May 2018 (link / cached copy) Utility Scale Solar - Empirical Trends in Project Technology, Cost, Performance, and PPA Pricing in the United States – 2018 Edition, Lawrence Berkeley National Lab (webpage / report / cached report) Lists of Worldwide Solar Plants: List of Photovoltaic Power Stations, Wikipedia (link / cached copy) List of Solar Thermal Power Stations, Wikipedia (link / cached copy) Concentrating Solar Projects, U.S. National Renewable Energy Lab - NREL (link / cached copy) The preceding is a particularly useful multi-webpage site that presents data sorted by either country, project name, technology employed, or plant's operational status I searched for a corresponding NREL list of PV Solar Projects, but was unsuccessful. Google supplied a number of promising NREL links, but all are now broken (error 404 / page not found). The Trump administration may have deliberately suppressed this information (I provide concrete evidence of their suppressing data on U.S. greenhouse gas emissions in my web note set "Greenhouse Effect, Carbon Footprint & Sequestration" (pptx / pdf / key)). The most relevant NREL document I could find was this generalized (non-plant specific) report on utility scale solar PV technology: Utility Scale PV Power Plants, Annual Technology Baseline 2017, NREL (link / cached copy) Lists of U.S. Solar Plants: Major Solar Projects List, Solar Energy Industry Association - SEIA, 2019 (link / cached copy) The original (non-cached) webpage provides an interactive map displaying and identifying more than one hundred U.S. PV and CSP/Solar Thermal energy plants: 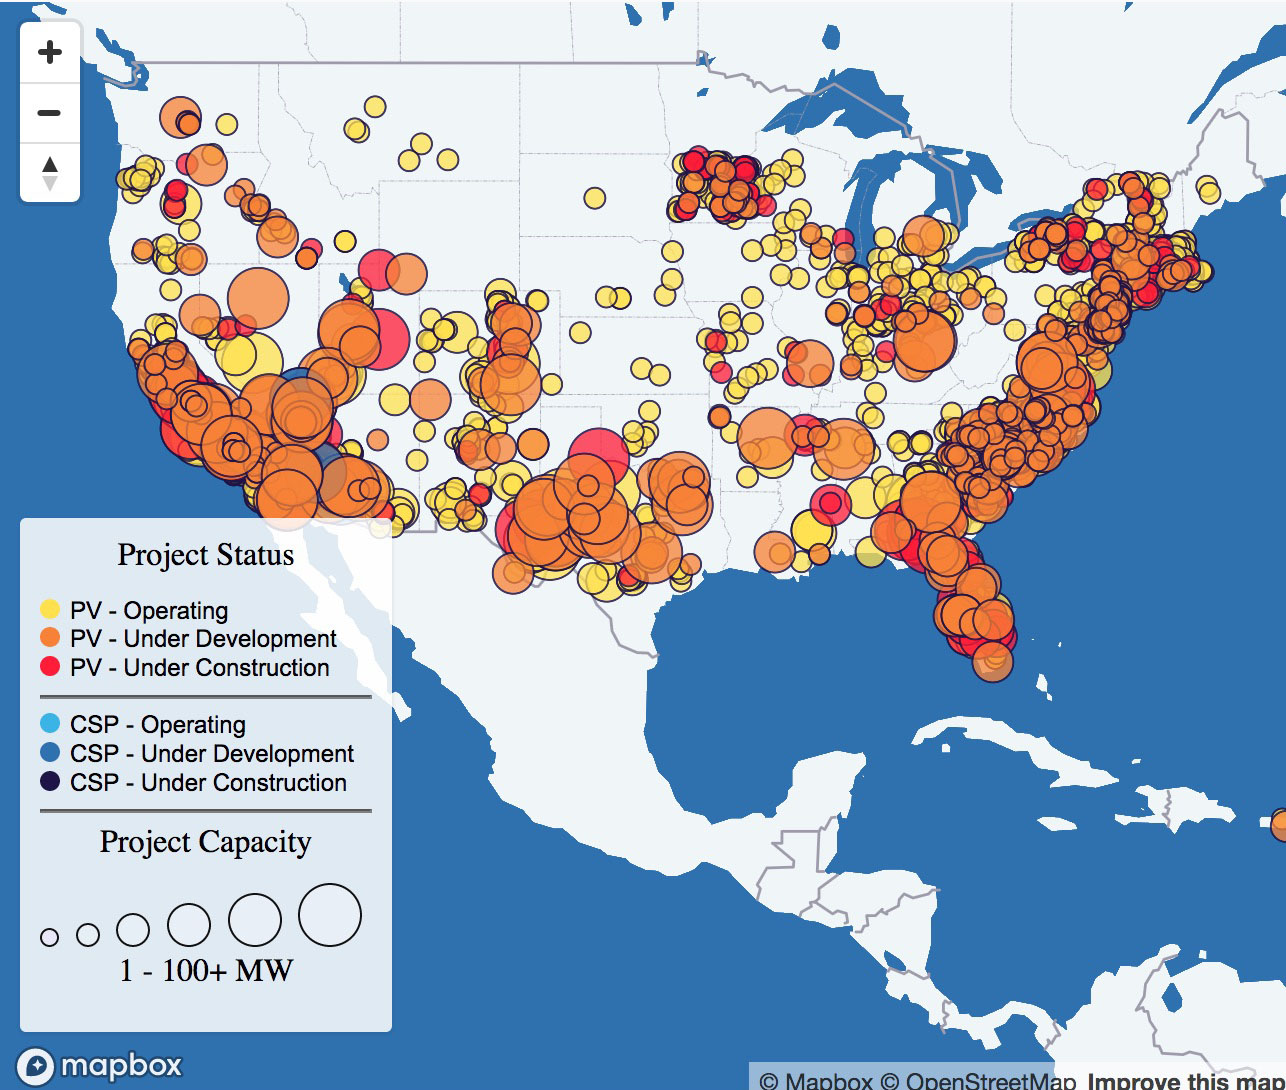
Most Commonly Used Types of PV Solar Cell: Utility Solar Photovoltaic Capacity is Dominated by Crystalline Silicon Panel Technology, 2017, U.S. Energy Information Administration (link / cached copy) Best Thin Film Solar Panels – Amorphous, Cadmium Telluride or CIGS? Energy Informative Org, 2015 (link / cached copy) Cadmium Telluride Photovoltaics, Wikipedia (link / cached copy) Copper Indium Gallium Selenide Solar Cells - Wikipedia (link / cached copy) Solar Frontier to Supply World's Largest CIGS Solar Plant, Reuters 2017 (link / cached copy) Catalina Solar Project, Power Technology Com (link / cached copy) CIGS is Back, Back Again, PV Magazine 2018 (link / cached copy) Sun-Tracking vs. Non-Sun-Tracking PV Solar* Plants: Solar Trackers, Solar Choice (link / cached copy) Solar Tracker, Wikipedia (link / cached copy) To Track or Not to Track - Part I, Greentech Media 2012 (link / cached copy) To Track or Not to Track - Part II, Greentech Media 2012 (link / cached copy) Why Solar Tracking is a Key Technology for Unlocking the Potential of Utility-Scale PV, Solar Power World Online, 2015 (link / cached copy) Trackers Dominate U.S. Utility-Scale Solar, PV Magazine 2017 (link / cached copy) More than Half of Utility-Scale Solar Photovoltaic Systems Track the Sun Through the Day, US Energy Information Administration 2017 (link / cached copy) *Concentrating Solar Plants (of ALL types) MUST track! My Data Table on Worldwide Solar Power Plants of at least 200 MW Capacity: This and other tables are provided in the accompanying Web Notes (pptx / pdf / key) Data sources are those given above, plus others identified in the Web Notes The spreadsheet used to generate these tables is available at this LINK | POWER PLANT | COMPLETED | PV | ST | PLANT AREA | PLANT NAME | COUNTRY | PV TECHNOLOGY | ST TECHNOLOGY | | CAPACITY |
|
|
| in km2 |
|
|
|
| | in MW |
|
|
|
|
|
|
|
| |
|
|
|
|
|
|
|
|
| | 1547 | 2016 | X |
| 43 | Tengger Desert | China | (c-Si ?) |
| | 1515 | 2019 | X |
| 40 | Bhadia Solar | India | (c-Si ?) |
| | 1400 | 2019 | X |
| 53 | Pavagada | India | (c-Si ?) |
| | 1177 | 2019 | X |
|
| Noor Abu Dhabi | UAE | (c-Si ?) |
| | 1000 | 2017 | X |
| 24 | Kurnool Ultra Mega | India | (c-Si ?) |
| | 1000 | 2016 | X |
|
| Dataong Solar Power Top | China | (c-Si ?) |
| | 850 | 2015 | X |
| 23 | Longyangxia | China | (c-Si ?) |
| | 828 | 2018 | X |
| 24 | Villanueva | Mexico | (c-Si ?) |
| | 750 | 2018 | X |
|
| Rewa Ultra Mega | India | (c-Si ?) |
| | 690 | 2012 | X |
| 20 | Charanka | India | (c-Si ?) |
| | 648 | 2016 | X |
| 10.1 | Kamuthi | India | (c-Si ?) |
| | 613 | 2019 | X |
|
| Mohammed bin Rashid | UAE | (c-Si ?) |
| | 579 | 2015 | X |
| 13 | Solar Star | US | (c-Si ?) |
| | 552 | 2016 | X |
| 16.2 | Copper Mountain | US | (c-Si ?) |
| | 550 | 2015 | X |
| 16 | Desert Sunlight | US | (c-Si ?) |
| | 550 | 2014 | X |
| 19 | Topaz | US | CdTe Thin Film |
| | 510 Thermal + 72 PV | 2013-18 | X | X | 4.5 Tower + 6.8 Trough + 5.5 Tower | Noor Quarzazate | Morocco | (c-Si ?) | Tower + Trough + Tower | | 500 | 2014 | X |
| 23 | Huanghe | China | (c-Si ?) |
| | 500 | 2018 | X |
|
| NP Kunta | India | (c-Si ?) |
| | 500 | 2018 | X |
|
| Three Gorges Golmud | China | (c-Si ?) |
| | 500 | 2018 | X |
|
| Three Gorges Delingha | China | (c-Si ?) |
| | 460 | 2018 | X |
| 15.9 | Mount Signal | US | (c-Si ?) |
| | 400 | 2016 | X |
| 9.3 | Mesquite | US | (c-Si ?) |
| | 400 | 2018 | X |
|
| Pirapora | Brazil | (c-Si ?) |
| | 400 | 2019 | X |
| 17 | Ananthapurama | India | (c-Si ?) |
| | 392 | 2014 |
| X | 14.2 | Ivanpah | US |
| Tower | | 380 | 2016 | X |
|
| Yanchi | China | (c-Si ?) |
| | 350 | 2019 | X |
| 5.7 | Springbok | US | (c-Si ?) |
| | 310 | 1984-90 |
| X | 6.5 | SEGS | US |
| Trough | | 300 | 2015 | X |
| 2.5 | Cestas | France | (c-Si ?) |
| | 300 | 2019 | X |
| 9.3 | Techren | US | (c-Si ?) |
| | 292 | 2017 | X |
|
| Nova Olinda | Brazil | (c-Si ?) |
| | 290 | 2014 | X |
| 9.7 | Aqua Caliente | US | CdTe Thin Film |
| | 280 | 2017 | X |
| 11.7 | California Flats | US | (c-Si ?) |
| | 280 | 2014 |
| X | 7.14 | Mojave | US |
| Trough | | 280 | 2013 |
| X | 7.8 | Solana | US |
| Trough | | 280 | 2014 |
| X | 7.8 | Genesis | US |
| Trough | | 260 | 2018 | X |
|
| Don Jose | Mexico | (c-Si ?) |
| | 254 | 2017 | X |
|
| Ituverava | Barzil | (c-Si ?) |
| | 250 | 2017 | X |
|
| Mandsaur | India | (c-Si ?) |
| | 250 | 2016 | X |
| 9.3 | McCoy | US | (c-Si ?) |
| | 250 | 2016 | X |
| 11.7 | Silver State | US | (c-Si ?) |
| | 250 | 2013 | X |
| 7.96 | California Valley | US | (c-Si ?) |
| | 250 | 2016 | X |
| 6.82 | Stateline | US | (c-Si ?) |
| | 250 | 2016 | X |
| 8.1 | Moapa Southern Paiute | US | (c-Si ?) |
| | 246 | 2016 | X |
|
| El Romero | US | (c-Si ?) |
| | 246 | 2019 | X |
|
| Nikpol | Ukraine | (c-Si ?) |
| | 240 | 2019 | X |
|
| Pokrovske | Ukraine | (c-Si ?) |
| | 240 | 2016 | X |
| 7.7 | Escalante | US | (c-Si ?) |
| | 236 | 2019 | X |
| 6.1 | Midway | US | (c-Si ?) |
| | 235 | 2016 | X |
| 8.1 | Blythe | US | (c-Si ?) |
| | 235 | 2018 | X |
| 2.6 | Setouchi Kirei | Japan | (c-Si ?) |
| | 235 | 2017 | X |
| 7.7 | Upton Solar 2 | US | (c-Si ?) |
| | 230 | 2015 | X |
| 8.5 | Antelope Valley | US | CdTe Thin Film |
| | 212 | 2016 | X |
| 5.3 | Roserock | US | (c-Si ?) |
| | 202 | 2018 | X |
| 5.1 | Buckthorn | US | (c-Si ?) |
| | 200 | 2017 | X |
| 3 | Cixi | China | (c-Si ?) |
| | 200 | 2019 | X |
| 8.1 | GA Solar 4 | US | (c-Si ?) |
| | 200 | 2013 | X |
|
| Gansu Jintai | China | (c-Si ?) |
| | 200 | 2016 | X |
| 8.1 | Garland | US | (c-Si ?) |
| | 200 | 2013 | X |
|
| Gonghe I | China | (c-Si ?) |
| | 200 | 2018 | X |
| 6.5 | Great Valley | US | (c-Si ?) |
| | 200 | 2016 | X |
| 7.7 | Tranquility | US | (c-Si ?) |
| | 200 | 2012-13 |
| X |
| Solaben | Spain |
| Trough | Trade Website / Magazine Articles about the Largest Worldwide Plants: Warning: Despite their inclusive titles, the following two articles both list ONLY PV Plants. Further, their lists include PV Plants producing less (or even much less) power than the largest Solar Thermal Plants (yet another example of why we not only CAN but MUST "Figure This Out" for for ourselves): The Nine Biggest Solar Power Plants in the World, PowerTechnology.Com (link / cached copy) An Overview of the World’s Largest Solar Power Plants, Photovoltaics Magazine (link / cached copy) Copyright: John C. Bean (WeCanFigureThisOut.org) |